The monthly U-M Google Summaries inform the university community of Google releases for Core Apps as well as the Non-Core Apps (those that are not part of the G Suite for Education agreement). We communicate important information on Core Apps throughout the month. Core and Non-Core Apps are listed on the G Suite website.
Core Apps:
In order to help the university community secure their Hangouts Meet sessions, the ITS Collaboration Services team created a quick guide with steps to ensure your meetings stay private and free of unwanted attendees.
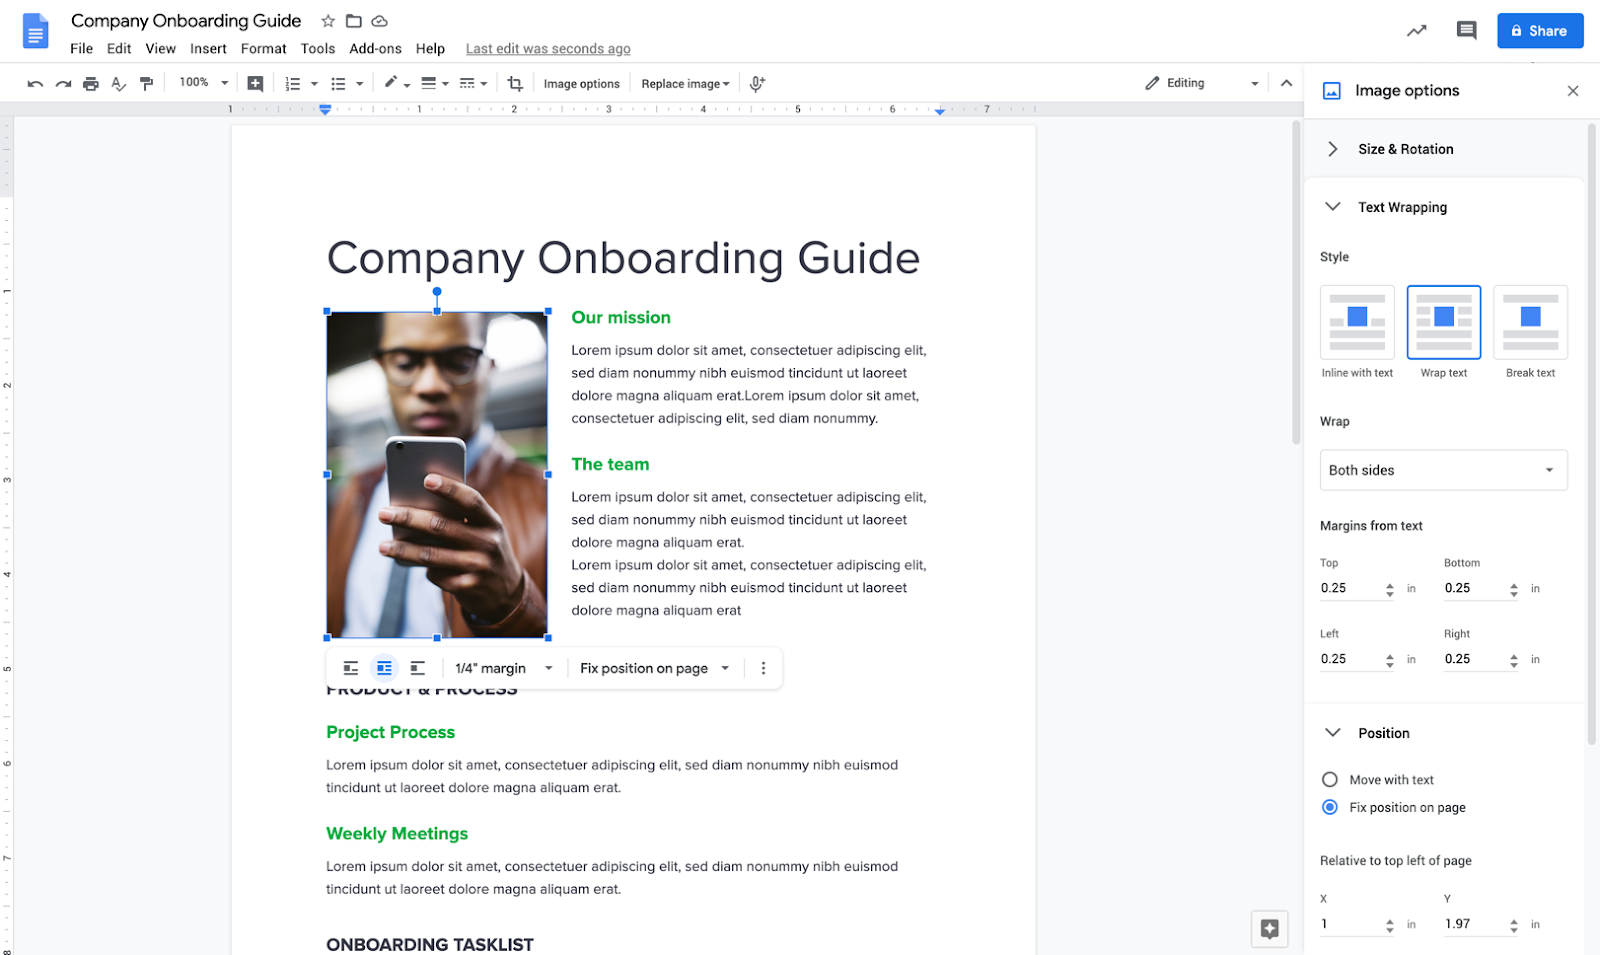
In Google Docs, you will soon be able to position an image in a fixed place, ensuring it stays in a certain spot on the page and is not disrupted by text and other elements. Google has also added a new sidebar where you can quickly access other image formatting options such as size, rotation, and brightness/contrast settings.
To position an image on a Doc page, click the image and select “Fix position on page” from the menu bar below it. To open the “Image options” sidebar, click the three-dot overflow menu and then select “All image options” from the same menu bar below the image. To learn more about formatting images in Google Docs, see this article from Google's Help Center.
In Google Sheets, it will soon be easier to locate and select the data you need when creating a dashboard over a dataset with slicers, pivot tables, charts, and more. Previously, all data ranges on a table would be used when creating a chart. Now, you’ll be able to select which columns to use for the chart axis and series. This allows you to quickly customize your charts so that they display the most relevant data.
In the chart editor, you can select a column as the X-axis. Under “Series” then select additional columns to populate your chart.