Overview
For a quick introduction to My Learning Analytics (MyLA), check out the following overview video.
Course Homepage
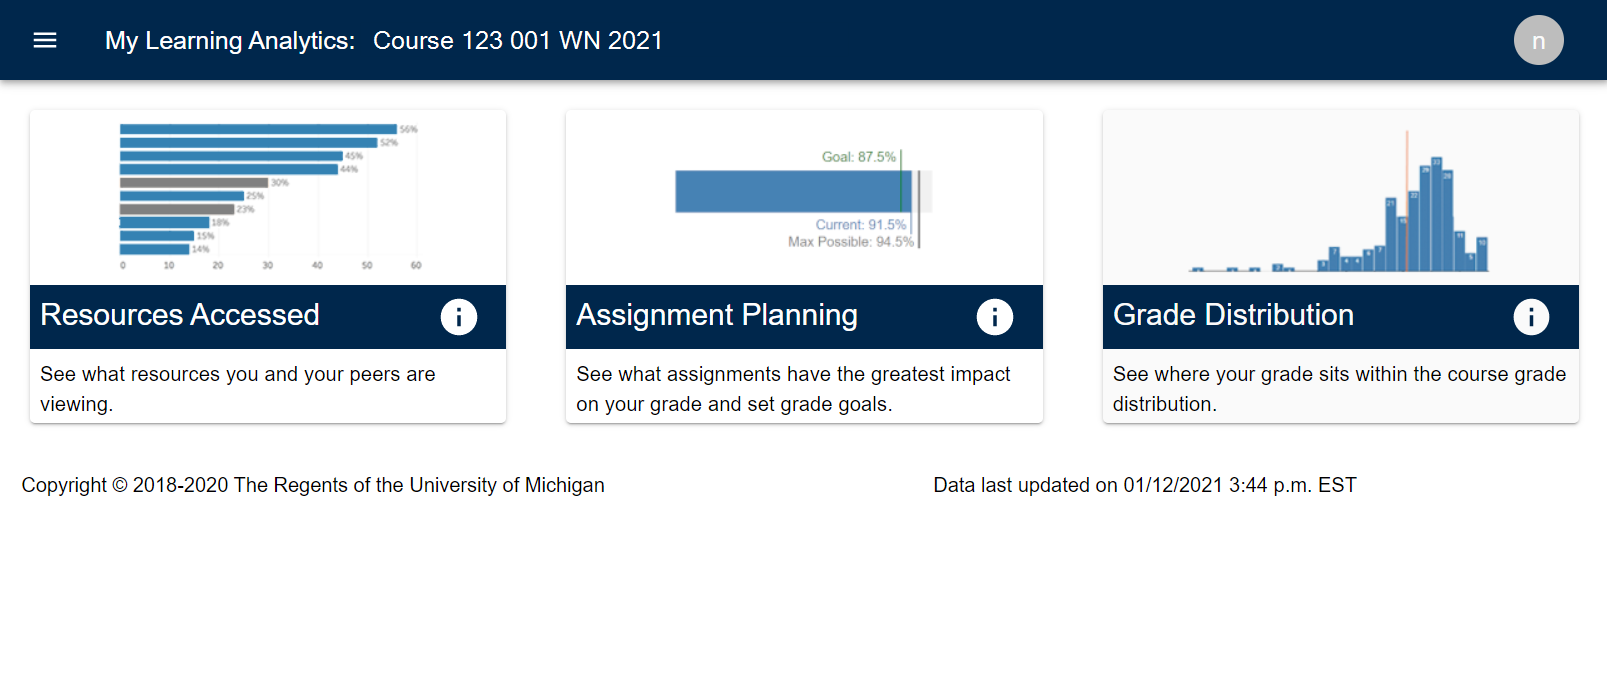
Visualizations available for a course, as determined by your instructor, are displayed on the MyLA course homepage. Click on the data visualization that you want to see. You can also use the menu in the upper left to move from one visualization to another.
NOTE: My Learning Analytics uses data from your Canvas course. Only published content in Canvas displays here. This may differ from the assignments and readings listed in your syllabus.
Visualizations
- Resources Accessed: See what resources you and your peers are viewing.
- Assignment Planning: See what assignments have the greatest impact on your grade.
- Grade Distribution: See where your grade sits within the course grade distribution.
Additional Information and Help
If you couldn't find what you were looking for here or in the FAQ, please contact [email protected]